python与医学统计中的代表值,离差的度量
【代表中央数据的度量】
- 平均数
一组数据之和再除以数据的个数。表示数据的总体水平
优点:灵敏性好,一组数据中的任何一个都对其大小产生影响
缺点:容易受到极端值影响 - 中位数
指将数据按大小顺序排列,形成一个数列,处于数列中间位置的那个数据就称为中位数。表示数据的中等水平, 如果数据是偶数个,取最中间的两个数值的平均数作为中位数
优点:很少受极端值的影响
缺点:缺乏灵敏性,不能充分利用所有数据的信息 - 众数
一组数据中出现频数最多的那个数据 表示数据的普遍情况
优点:比较容易了解一组数据的大致情况,不受极端数据的影响
缺点:当一组数据变化很大时,它只能用来大略地估计一组数据的集中趋势 - 几何平均数
n个数据值连乘积的n次方根
优点:比平均数少受极端数据的影响
缺点:数据中有0,或者小于0的,不能用几何平均值
【代表离差的度量】
- 四分位距
第三的四分位数与第一的四分位数的差距 [第三四分位数 (Q3) – 第一四分位数 (Q1)]
表示分散情形的一种
将数据按大小顺序排列,形成一个数列,
位于第25%的数值就是第一四分位数 (Q1)
位于第75%的数值就是第三四分位数 (Q3) - 方差
n个变量值的数据中各个数据与该组数据的平均数的差的平方和除于(n-1) - 标准差
方差的算术平方根 - 变异系数
标准差/平均数
【使用python计算例】
———————————–
# -*- coding: utf-8 -*-
import statistics as st
import scipy.stats as scist
# 腹围数据
s = [83, 82, 86, 84, 87, 79, 81, 85, 82, 92]
print(‘腹围数据(data) = ‘, s)
print(‘平均数(mean) = ‘, st.mean(s))
print(‘中位数(median) = ‘, st.median(s))
print(‘众数(mode) = ‘, st.mode(s))
print(‘几何平均数(geometric mean) = ‘, scist.gmean(s))
print(‘第一四分位数 (Q1) = ‘, scist.scoreatpercentile(s,25))
print(‘第三四分位数 (Q3) = ‘, scist.scoreatpercentile(s,75))
print(‘四分位距(interquartile range) = ‘, scist.scoreatpercentile(s,75)-scist.scoreatpercentile(s,25))
print(‘方差(Variance) = ‘, st.variance(s))
print(‘标准差(standard deviation) = ‘, st.stdev(s))
print(‘变异系数(coefficient of variation: CV) = ‘, st.stdev(s)/st.mean(s))
———————————–
结果:
———————————–
腹围数据(data) = [83, 82, 86, 84, 87, 79, 81, 85, 82, 92]
平均数(mean) = 84.1
中位数(median) = 83.5
众数(mode) = 82
几何平均数(geometric mean) = 84.029574619
第一四分位数 (Q1) = 82.0
第三四分位数 (Q3) = 85.75
四分位距(interquartile range) = 3.75
方差(Variance) = 13.433333333333332
标准差(standard deviation) = 3.665151201974256
变异系数(coefficient of variation: CV) = 0.043580870415865114
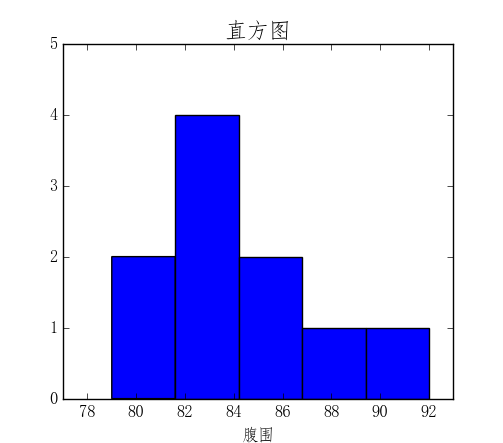
- 直方图
可直观地表示数据分布的情况
【使用python生成直方图例】
———————————–
from matplotlib import pyplot as plt
from math import log, ceil
# 腹围数据
s = [83, 82, 86, 84, 87, 79, 81, 85, 82, 92]
data = [s]
plt.rcParams[‘font.sans-serif’] = ‘FangSong’ # 仿宋
fig = plt.figure()
ax = fig.add_subplot(1,1,1)
ax.set_title(‘直方图’, size=16)
ax.set_xlabel(‘腹围’)
bs = int(ceil(1 + (log(len(s), 2)))) # 这里组数用史特基公式(Sturges’ formula)计算
ax.hist(s, bins=bs)
[xmin, xmax ,ymin, ymax] = plt.axis()
plt.axis([xmin – 1, xmax + 1,ymin, ymax + 1])
plt.show()
———————————–
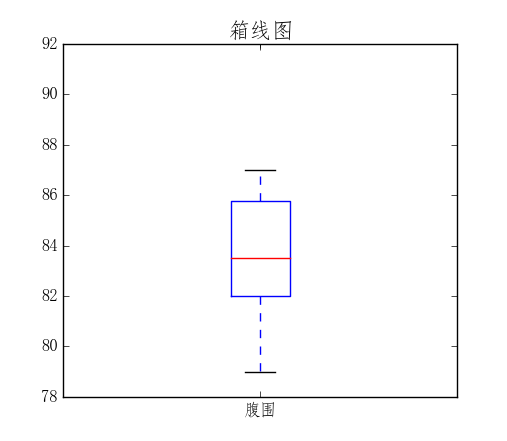
- 箱线图
可用来显示数据的分散情况,中心趋势,变异性
【使用python生成箱线图例】
———————————–
from matplotlib import pyplot as plt
# 腹围数据
s = [83, 82, 86, 84, 87, 79, 81, 85, 82, 92]
data = [s]
lbl = [‘腹围’]
plt.rcParams[‘font.sans-serif’] = ‘FangSong’ # 仿宋
fig = plt.figure()
ax = fig.add_subplot(1, 1, 1)
ax.set_title(‘箱线图’, size=16)
plt.boxplot(data, labels=lbl)
plt.show()
———————————–
2016-06-15